By Nikhil Vinod - July 30, 2026
Introduction
Many years ago, I remember my third-grade science teacher giving our class an assignment on fossil fuels and renewables. The issue of climate change was a big deal; I found a lot of importance in renewable energy investments all the way back then. Fast-forward to 2021, when the Texas power grid suffered a massive outage due to Winter Storm Uri.
The devastation and loss of that storm seemed to indicate a power system incapable of balancing supply and demand in extreme conditions: an energy infrastructure incapable of supporting the growing and future needs of its constituents. Or so I thought. But every year since then, even with unusually recurring winter weather, the electrical grid has not fallen to the level of 2021.
Now more than ever, energy is a growing critical industry. The demand from existing and future data centers, driven by booming AI investment, makes energy an even hotter commodity than usual. With so many of those investments happening in Texas, I thought it would be a good time to review why Texas is a key location: the changes in Texas power over the past decade.
The Texas Power Grid
The Texas Power Grid is particularly unusual in the United States. The United States is split into three major power grids: the Eastern Region, Western Region, and Texas, as described by the U.S. Environmental Protection Agency. Texas is the sole state that is mostly disconnected from the rest of the continental United States.
Whether that is good or bad is up for contention. The relative isolation allows it to be a useful analytics sample, though the lack of connections and support makes surviving emergencies difficult, as we saw with Uri. The Texas power grid is controlled by the Independent System Operator (ISO) known as ERCOT (Electric Reliability Council of Texas). ERCOT coordinates the wholesale market and real-time balance for approximately 90% of Texas load, according to its company profile.
Note: In the following analysis, I cover a ten-year period, specifically January 2016 through April 2026. Because 2026 is not complete, many graphs dealing with absolute amounts end in 2025.
ERCOT Annual Grid Data, 2016-2026
The table below compares the first complete year in the dataset with the latest complete annual data point.
| Measure | 2016 | 2025 | Change |
|---|---|---|---|
| ERCOT generation | 351.6 TWh | 488.4 TWh | +38.9% |
| Texas population estimate | 27.91M | 31.71M | +13.6% |
| Generation per resident | 12.6 MWh | 15.4 MWh | +22.3% |
| Wind + solar share | 15.4% | 37.4% | +22.0 points |
| Coal share | 28.8% | 12.9% | -15.9 points |
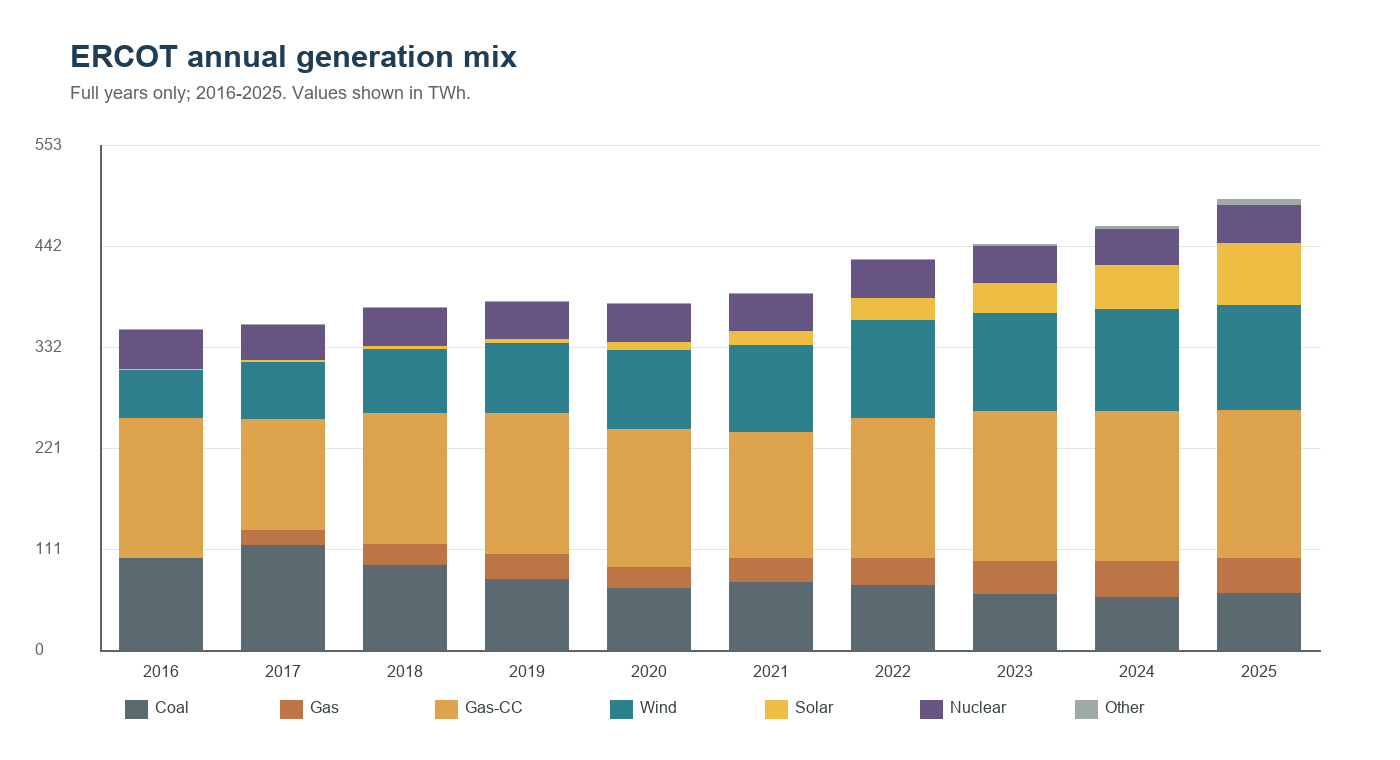
Figure 1. Annual ERCOT generation mix by source, 2016-2025. Stacked bars show total generation rising as coal declines and wind and solar expand.
Source: Author's analysis of ERCOT generation data.
Growth in Generation and Population
In 2016, ERCOT had 351.6 million megawatt-hours of electricity generated. By 2025, this number had jumped to 488.4 million megawatt-hours, a 38.9% increase from the 2016 figure. In that same period of time, Texas had just 13.6% population growth. Population growth alone is insufficient to explain the rise in output. Electricity generation also responds to weather, industrial activity, oil and gas operations, electrification, efficiency, commercial growth, exports across limited ties, and increasingly data centers and other large loads.
The Federal Reserve Bank of St. Louis population series gives the population estimates used here: 27,914,064 in 2016 and 31,709,821 in 2025. Additional ERCOT data is available through SaveOnEnergy's ERCOT analysis.
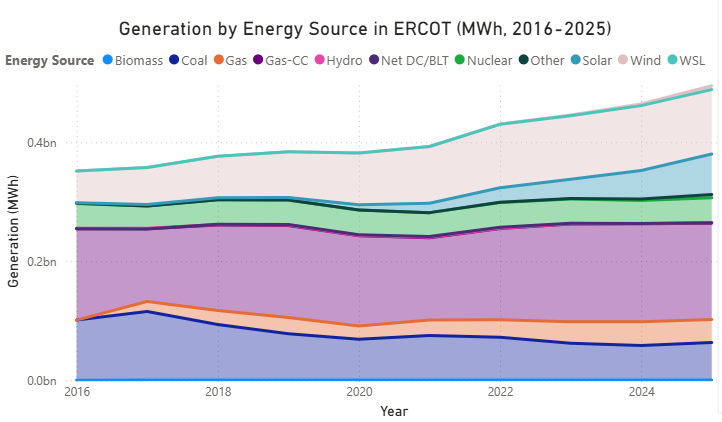
Figure 2. ERCOT generation by individual energy source, 2016-2025. The series compares coal, gas, combined-cycle gas, nuclear, wind, solar, and smaller sources.
Source: Author's analysis of ERCOT generation data.
Changes in the Generation Mix
Breaking down the total generated electricity, we can see clear trends in the energy mix. There is limited change in nuclear electricity generation. However, generation from coal has a notable decrease. Gas-based generation has increased slightly, a similar amount to the decrease in coal. However, wind and solar have had the greater increases in production since 2016.
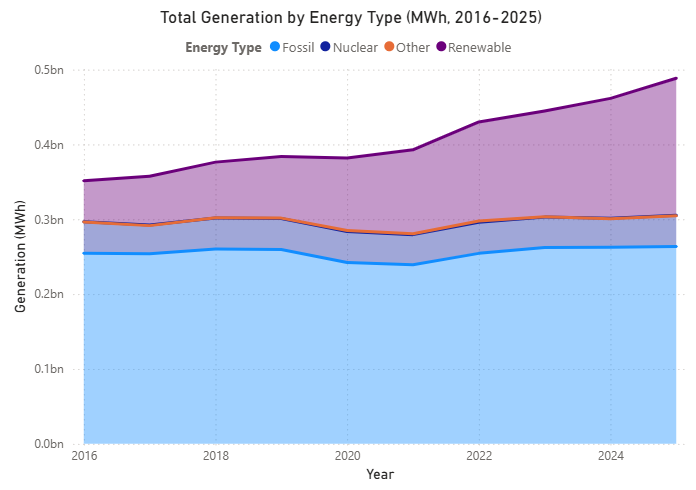
Figure 3. Total ERCOT generation by energy type, 2016-2025. Fossil generation remains comparatively stable while renewable generation increases.
Source: Author's analysis of ERCOT generation data.
Fossil-Fuel Generation
From Figure 3, the total amount of fossil-fuel electricity sources has not diverged noticeably in 2025 compared to the 2016 value. The same holds true for nuclear, as mentioned previously. There is a small dip in generation for fossil fuels in 2020 and 2021, though this was likely a result of the global pandemic. As the pandemic concluded, the rates seem to rebound to standard levels.
The Shift from Coal to Natural Gas
Although fossil fuels remain constant as a source overall, internally there is some entropy. Or rather, a decline in one player. Coal seems to be steadily declining over the past decade, with natural gas replacing its electricity generation load. Coal went from almost 40% of fossil-fuel generation to a little over 26%, a 33% decline in electricity generation from the fuel source. With natural gas known to burn more cleanly relative to coal and easier access to the boom in fracking, coal has been taking the back burner, so to speak, in Texas electricity production, both as a fossil fuel and as a whole.
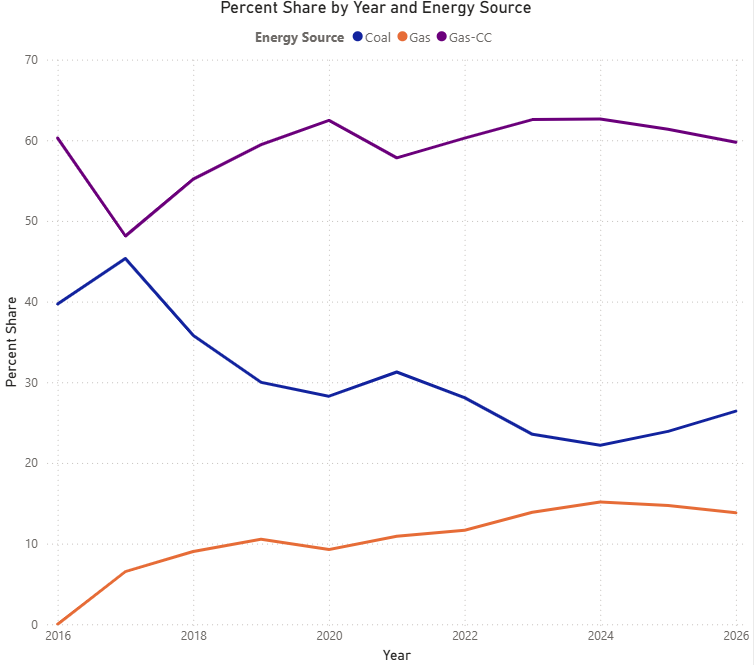
Figure 4. Share of ERCOT fossil-fuel generation by source, 2016-2026. Coal's share falls as combined-cycle and other gas generation gain share.
Source: Author's analysis of ERCOT generation data.
Figure 4 clearly indicates the decrease in the percentage contribution of coal to total fossil-fuel generation. In fact, a very interesting pattern is the mirrored change between coal and combined-cycle gas. Combined-cycle gas seems to increase at the same rate coal decreases, indicating a clear shift in fossil fuels from one to the other. Combined-cycle gas is a highly efficient method to produce electricity for the grid, while standard gas represents combustion plants for peak energy requirement periods. The U.S. Energy Information Administration describes how gas-fired generation technologies differ across regions.
Renewable-Energy Growth
There is clear growth in the renewable sector for overall generation over the ten-year period. In fact, there was a 233% increase in renewable energy generation in the ERCOT region over the past decade. As a percentage of total market share, renewables jumped from under 20% in 2016 to over 35% in 2025.
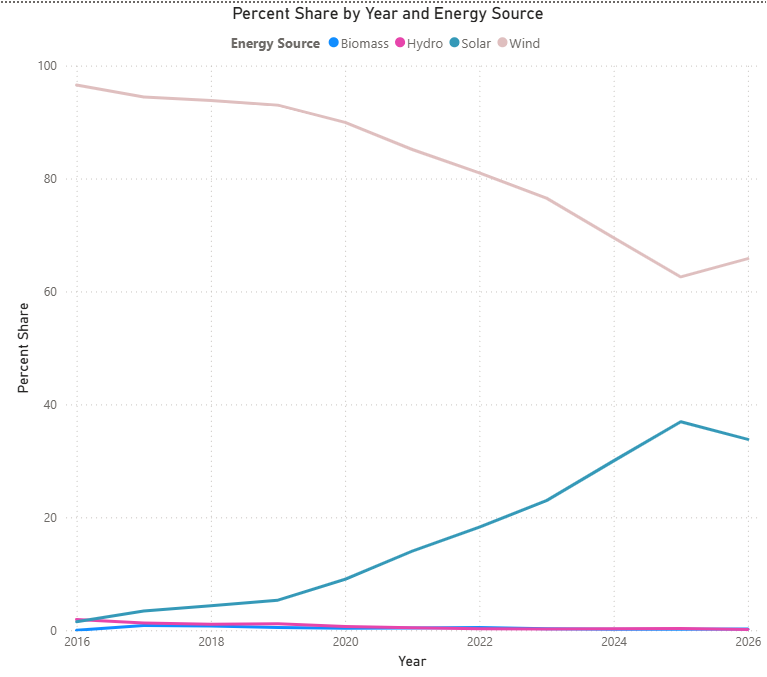
Figure 5. Share of ERCOT renewable generation by source, 2016-2026. Wind remains the largest renewable source while solar grows rapidly.
Source: Author's analysis of ERCOT generation data.
Wind and Solar
Among the renewables, two players are particularly notable in Texas: wind and solar. Wind had a modest foothold in 2016 and was the largest renewable player by a great margin, more than 96% (Figure 5). Over the past decade, wind-based electric generation grew at a steady linear rate, with 2025 generating over double the MWh in 2016. Solar, on the other hand, was barely present in 2016 generation metrics, composing less than 2% of total renewable generation. Nevertheless, over the years, solar generation grew at an exponential rate, ending up with over 8000% higher MWh production in 2025 compared to 2016. Solar skyrocketed to 33.8% of all renewable generation and 14.5% of all generation by 2026 so far.
From the annual data collected, it is clear to see the biggest winner is solar by far, with wind being a not-too-distant second place. The renewables seem most responsible for the increase in overall electricity generation in the ERCOT system over the past decade. Natural gas is increasing in usage as well, but not beyond typical fossil-fuel generation. It is to be determined if natural gas will retain the same growth rate and break out of the current fossil-fuel generation limit I have observed. By far, the biggest loser is coal, which seems to be losing relevance in the electric-generation market in Texas, by my interpretation. Future power needs may prohibit that, though.
Renewable growth and gas investment occurred simultaneously because they solve different parts of the operating problem. Wind and solar provide low-marginal-cost energy when available. Gas generation, storage, transmission, and demand response help cover ramps, weather-dependent output, and peak-load intervals.
ERCOT Monthly Grid Data, 2016-2026
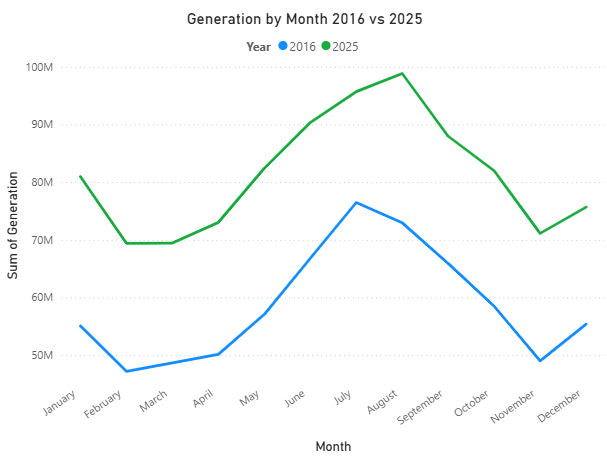
Figure 6. Monthly ERCOT generation in 2016 and 2025. The comparison shows higher generation in every month and a pronounced summer peak.
Source: Author's analysis of ERCOT generation data.
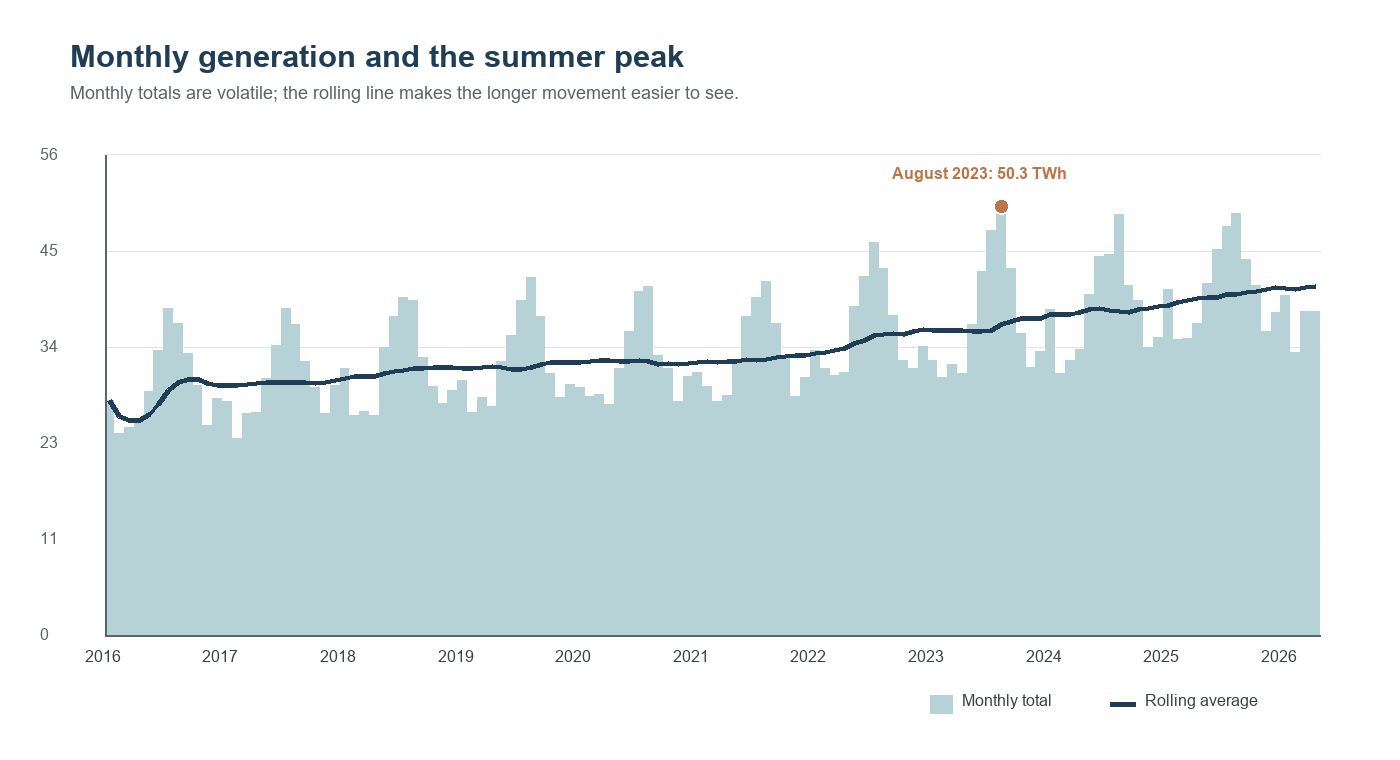
Figure 7. Monthly ERCOT generation and rolling average, 2016-April 2026. Monthly totals are seasonal, while the rolling average shows the longer-term increase.
Source: Author's analysis of ERCOT generation data.
Monthly Growth and Summer Peaks
The highest monthly generation in the dataset was August 2023 at 50.3 TWh. Monthly totals reveal the upward trend over the years. Summer months also show the distinct dominance of air-conditioning load, quite a necessity in the Texas heat. Still, a monthly view is coarse for reliability analysis; the system can be comfortable for most of a month and unreliable during a few evening or extreme-weather hours.
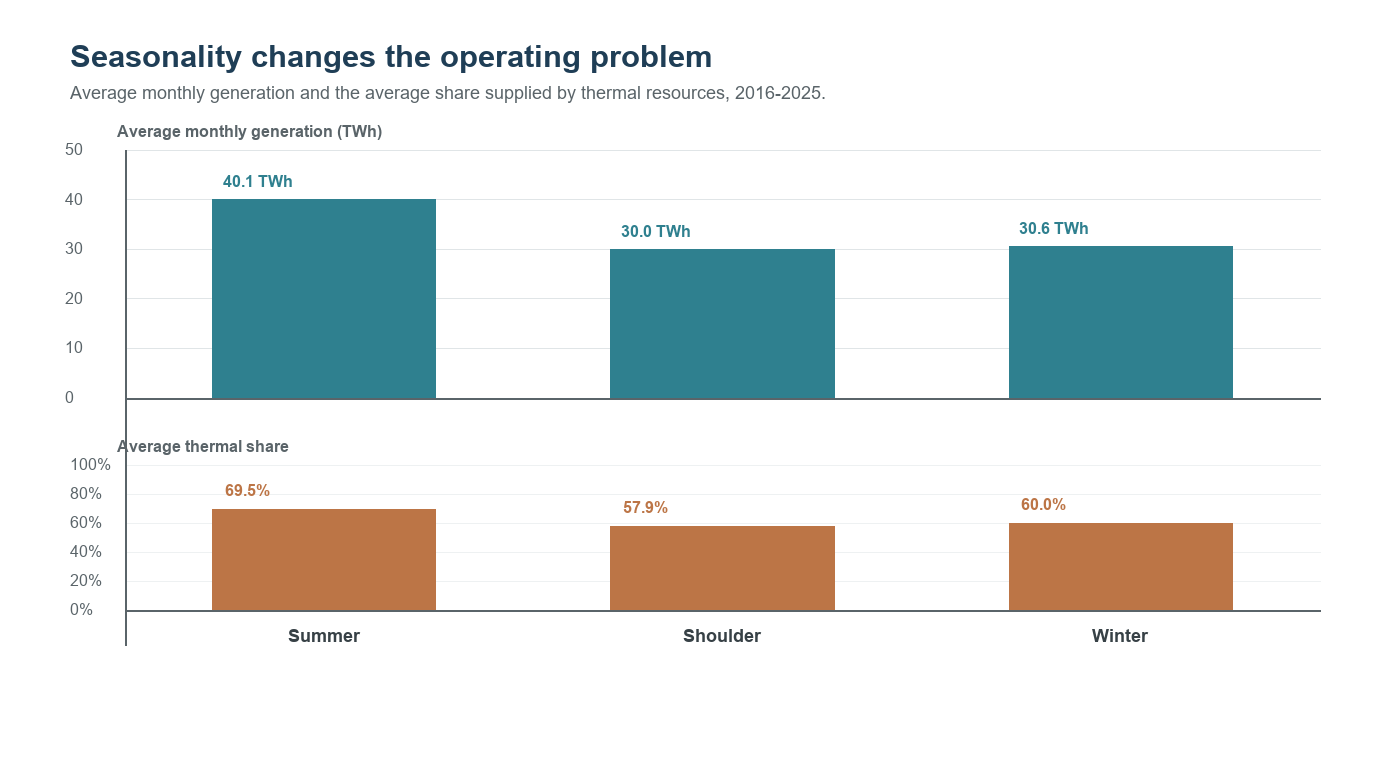
Figure 8. Average monthly generation and thermal share by season, 2016-2025. Summer has both the highest output and the highest average thermal share.
Source: Author's analysis of ERCOT generation data.
Seasonality and Reliability
Summer had the highest average monthly generation and the highest thermal share in the decade data. Wind often contributes more strongly outside summer, while solar increasingly supports daytime summer demand. The difficult transition occurs as solar output falls toward evening while load can remain high.
2026 Year-to-Date and the Demand Record Watch
January-April 2026 wind-plus-solar share was 44.6%, versus 41.2% for the same months of 2025. This is a like-for-like early-year comparison, not a complete annual result. Separately, July 2026 reporting described demand approaching the existing 85,508 MW record. Demand records should be treated as preliminary until ERCOT publishes settled values.
Conclusions
ERCOT has had immense growth in the past ten years, with generation increasing 38.9%. A significant amount was brought about by the stunning growth of renewables, as well as the reduction of coal-based generation, down to 12.9%, and the growth of cleaner-burning natural gas. Of the renewables, solar has had incomparable growth over the past decade. The combination of cheaper renewables and flexibility offered by batteries and gas generators allows for the growth seen in the Texas market.
Next Steps
Considering the data so far, my next steps are to identify the specific investments and technologies resulting in this growth in generation. Additionally, from May 2016 to May 2026, the S&P grew 264%. Regarding the same period, I will review public companies' growth involved in the Texas power grid relative to the greater index.
By identifying the decisions of participants in the ERCOT market, I can further identify issues in present struggling markets. Additionally, exploring similarly successful industries and markets can also help to outline potential directions of ERCOT.
Constantly evolving technologies such as AI will have revolutionary implications for the electric markets. Whether it is in terms of electric demand from data centers and robotics, or technological innovations possible from processes run by models, there are a plethora of factors contributing to the evolution of power markets.
References
- Electric Reliability Council of Texas. "Company Profile." Accessed July 30, 2026.
- Federal Reserve Bank of St. Louis. "Resident Population in Texas (TXPOP)." Accessed July 30, 2026.
- SaveOnEnergy. "ERCOT's Energy Evolution: Here's What We Found Through a 20-Year Analysis." Accessed July 30, 2026.
- Texas Division of Emergency Management. "Texas Severe Winter Storm DR-4586." Accessed July 30, 2026.
- U.S. Energy Information Administration. "Use of Natural Gas-Fired Generation Differs in the United States by Technology and Region." February 22, 2024.
- U.S. Environmental Protection Agency. "About the U.S. Electricity System and Its Impact on the Environment." Accessed July 30, 2026.
- U.S. Environmental Protection Agency. "Power Market Structure." Accessed July 30, 2026.
- U.S. Environmental Protection Agency. "U.S. Grid Regions." Accessed July 30, 2026.
- Wikipedia contributors. "2021 Texas Power Crisis." Accessed July 30, 2026.