A few days ago, the 2026 FIFA World Cup came to a stunning conclusion with Spain's 1-0 victory against the reigning champions, Argentina. It was a devastating defeat for the greatest of all time, Lionel Messi, yet it appeared to mark the passing of the torch from the greatest player of the previous generation (and arguably now as well) to the boy he bathed as a baby, Lamine Yamal.
To be entirely honest, Yamal did not perform as incredibly as I expected. In fact, his fellow teenage teammate Pau Cubarsi won the Young Player of the Tournament Award instead. Regardless, it was a fantastic game, at least for Spain.
Argentina had zero shots on goal in the full 90 minutes of standard game time: a terrible offensive showing, in my opinion. They seemingly could not get the ball past their own half and resorted to playing defense, something I believe is actively detrimental to winning in the World Cup.
I noticed this pattern in many games throughout the tournament. In Brazil vs. Japan, Japan lost after attempting to go all-out on defense. Even in England vs. Argentina, critics online clowned England's decision to "park the bus" against one of the strongest offensive players in the history of the sport. But this was all speculation and vibes on my part. I wanted to know whether there truly is a correlation between offensive capability and victory.
So I decided to do some analysis. I gathered data from FootyStats for the 2026 World Cup, as well as the six previous World Cups.
The 2026 World Cup
The basic numbers were simple:
- 104 matches
- 2.96 total goals per match on average
- 54.8% of matches had both teams score
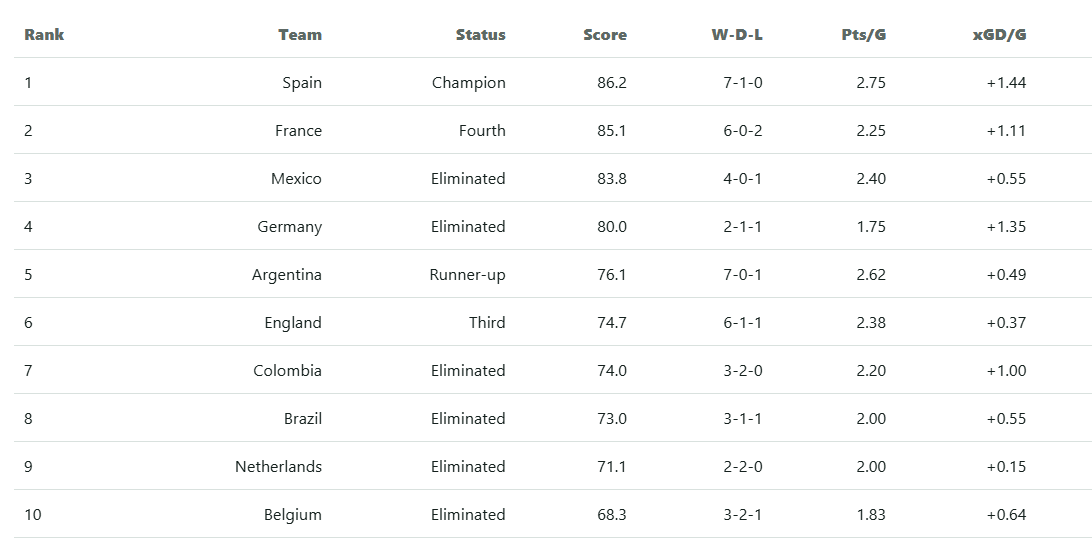
Figure 1. 2026 end-of-tournament results.
The team-strength view uses per-match rates, allowing teams with different match counts to be compared. Spain led points per match at 2.75 and owned the strongest raw expected-goal difference per match at +1.44.
One issue is that raw numbers can reward teams that faced weaker opponents. To account for opponent strength, I used the existing scores to create a strength-adjustment factor. The multiplier is centered at 1.00 and capped between 0.65x and 1.35x. Spain led the adjusted ranking at 87, with the actual champion ranked first after adjustment. Canada moved from raw rank 12 to opponent-adjusted rank 19. Its opponents averaged 39.7 on the raw composite scale, producing a 0.971x schedule multiplier.
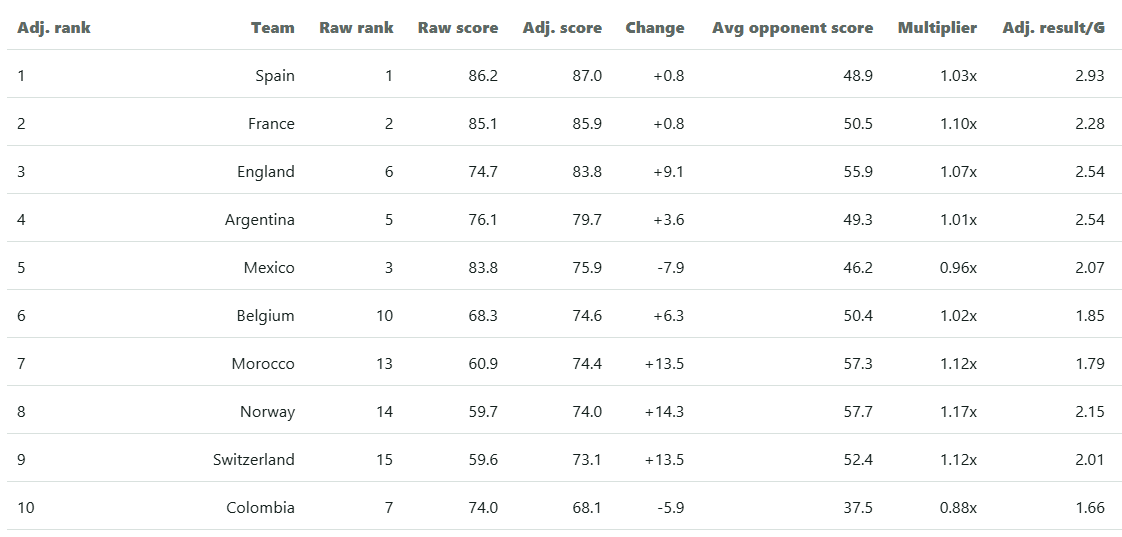
Figure 2. 2026 opponent-adjusted results.
Here we see the expected top performers dominating the highest ranks. The adjusted ranking is more reasonable for comparing schedules, but it does not prove that every quarterfinal team is better than every eliminated team. A team can rank highly after a short run because its per-match numbers are strong. Even with the adjustment, Mexico performed well this tournament, albeit less so after considering its opponents. As expected, the top ten is filled with quarterfinal competitors. I surmise this supports the tournament as a consistent indicator of the best teams.
Attack, Defense, and Efficiency
I also created offensive and defensive efficiency metrics. Chance creation is the shots-on-target rate divided by overall possession. Chance prevention is one minus the opponents' equivalent rate. I avoided goals here because goals directly define the match result.
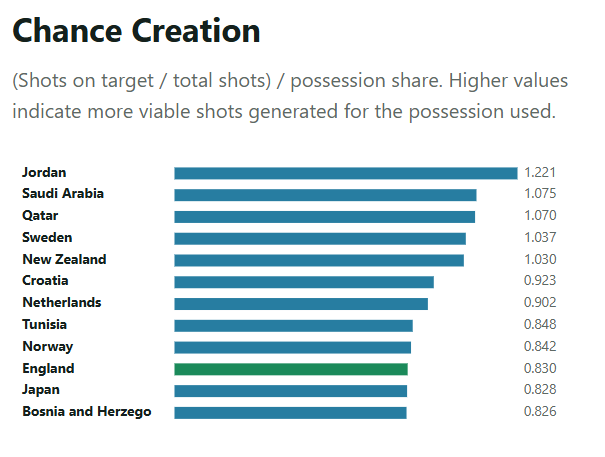
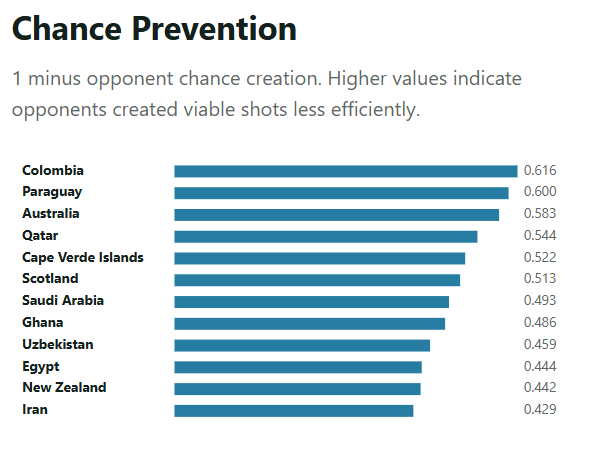
Figure 3. Chance creation and chance prevention.
The top-ten chance-creation chart contains only two quarterfinal teams: England and Norway. The chance-prevention top ten contains no quarterfinal teams. This shows that these metrics are not reliable rankings of tournament success by themselves.
The possession denominator rewards teams that create a lot from little possession, but it also makes small samples volatile. A more successful and oppressive team will have more possession, decreasing its results in these metrics. Furthermore, more shot attempts mean less variance and a more realistic shot-on-target probability. If a team has low possession but decides to use it to push forward, its denominator becomes smaller. If it then gets a shot on target, the metric becomes much larger. When there are few attempts, each one carries more weight and variance, resulting in a higher score.
Goalkeeper Strength
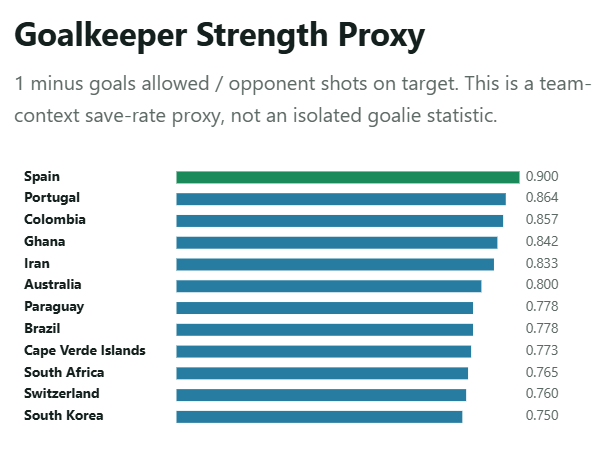
Figure 4. Raw goalkeeper strength proxy.
In addition to the other metrics, I created a metric to estimate goalkeeper strength. Shots on target are traditionally goals plus shots blocked by the keeper. By dividing goals allowed by all shots on target and subtracting that value from one, I determined the goalkeeper score. The raw result is consistent with Unai Simon winning the Golden Glove, although the award was not used to calculate the metric. The main caveat is the assumption that shots on target do not include any non-goalkeeper defensive efforts, which may also have played a part in blocked shots.
Prediction Through the Tournament
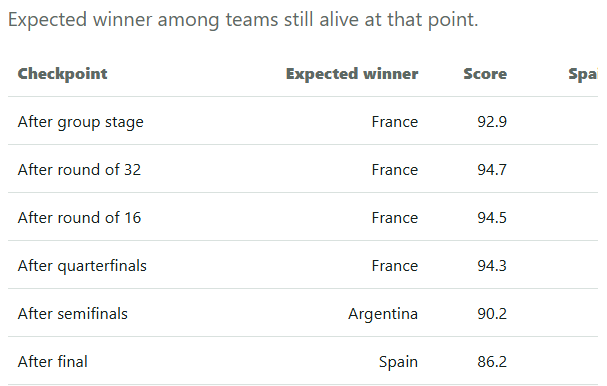
Figure 5. Model leader at successive tournament checkpoints.
I ran the ranking at several checkpoints. France led after the group stage, round of 32, round of 16, and quarterfinals. Argentina led after the semifinals, and Spain led only after the final was included. Although the final tournament metrics show Spain as a powerhouse, that strength was not fully present early in the tournament.
When Goals Were Scored
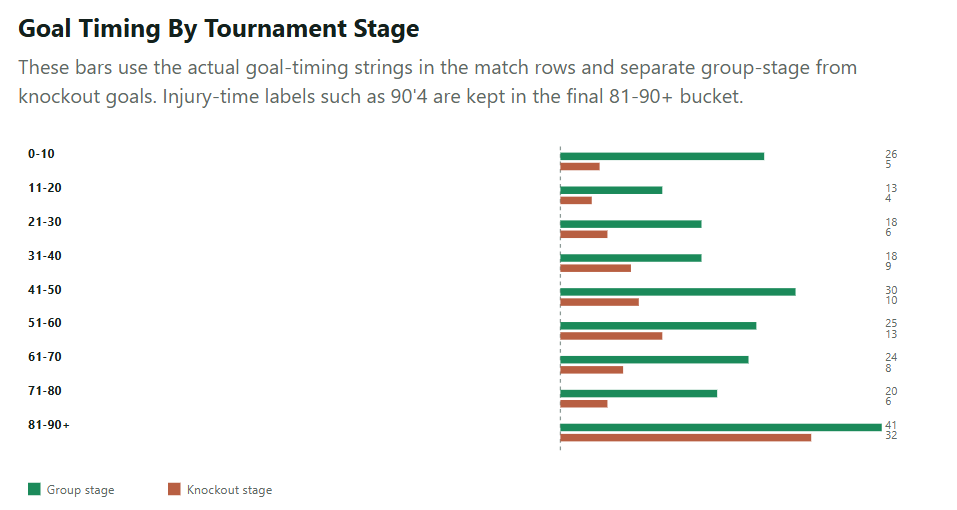
Figure 6. Goal timing by match interval.
The goal-timing chart suggests that goals are more common near the end of each half. Even with the pseudo-quarter-style structure produced by hydration breaks, the pattern does not appear to reflect it.
Looking Across Seven World Cups
The basic historical numbers were:
- 488 matches across 2002, 2006, 2010, 2014, 2018, 2022, and 2026
- 2.61 goals per group-stage match and 2.59 goals per knockout match
- Expected goals (xG) were available for only three of seven tournaments, while shots on target were available for five of seven. Missing fields make older tournaments less useful for detailed shooting comparisons.
How I Compared Teams
The data was analyzed using "edge" metrics. Instead of directly using shots on target or possession, I used the difference—the edge one team had over another. In a game where both teams have high shot totals, this helps maintain a constant value similar to a game where both teams have low totals. Since each match is between two teams, it makes sense to compare those two directly.
Goal Difference and Win or Lose
I used Pearson correlations to compare signed stat edges with signed final goal difference. Draws remain in this analysis. I then used logistic regression on 180 non-drawn matches with complete predictors to model wins versus losses directly. The logistic model is separate from the goal-difference analysis.
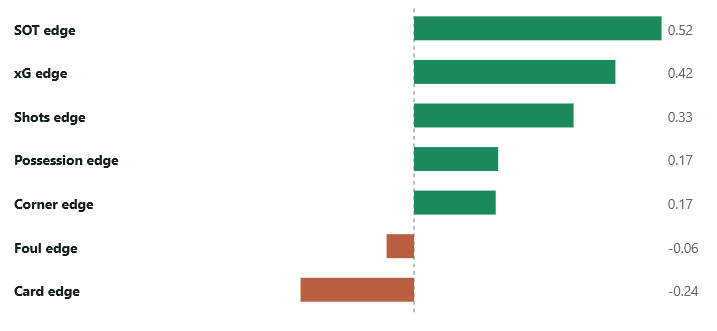
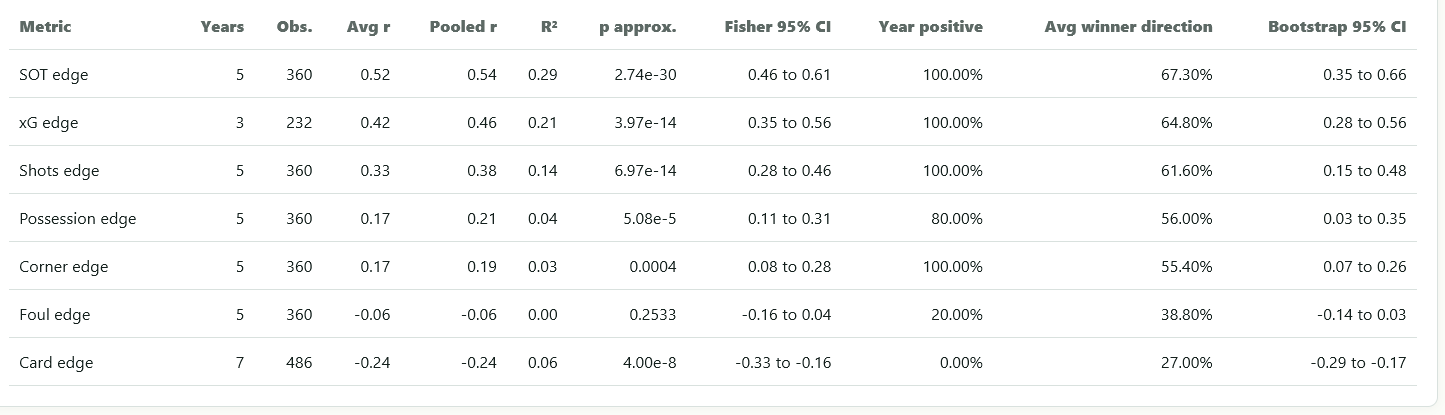
Figure 7. Match-stat associations with goal difference.
The strongest simple association was shots-on-target difference, with pooled r = 0.541 and R² = 0.292. If a team has significantly more shots on target than its opponent, it is likely to have a greater number of goals—a fairly intuitive result. xG difference was positive at r = 0.462, total shots at r = 0.377, and possession at r = 0.211. Card difference was negative at r = -0.245. These are associations, not causal effects, and the sizes are not large enough to explain every match.
Several associations have small approximate p-values, but that does not mean they are large, causal, or useful in every tournament. Foul difference was not significant in the pooled analysis. The tests also have different sample sizes and do not fully account for matches being grouped within tournaments.
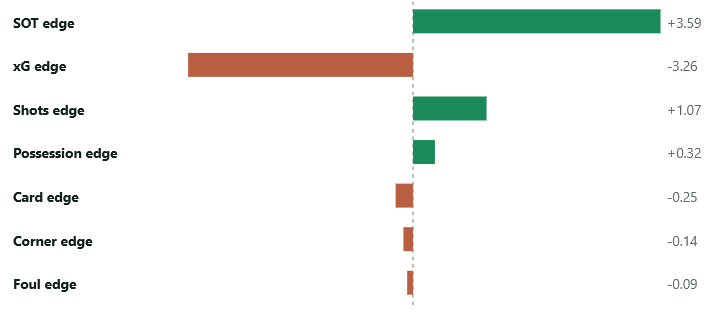
Figure 8. Logistic regression coefficients.
The logistic model was 78.9% accurate in-sample versus a 58.3% majority baseline, with AUC = 0.869 and pseudo-R² = 0.35. Shots-on-target difference had the largest positive coefficient. xG turned negative only after the model controlled for shots, shots on target, possession, and other overlapping variables. Its simple relationship with the result is positive. The negative coefficient indicates a significant amount of multicollinearity.
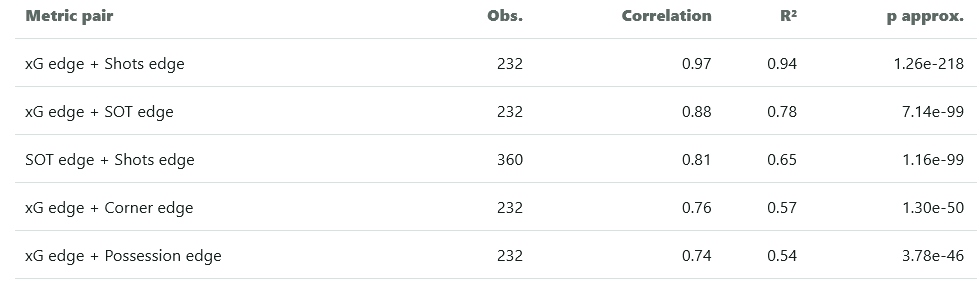
Figure 9. Correlations among team-stat edges.
xG appears in four of the five strongest pairwise relationships. Its overlap with total shots is about r = 0.97, and its overlap with shots on target is about r = 0.88. This is why a model that includes every variable can produce unstable conditional coefficients.
Offensive, Defensive, and Overall Capacity
I also created offensive, defensive, and overall capacity scores from normalized team metrics. The historical leaders include 2010 Argentina, Portugal, and Uruguay on offense; 2026 Spain, 2018 Brazil, and 2022 Brazil on defense; and 2018 Brazil, 2026 Spain, and 2026 Canada on overall capacity.
Opponent Strength
Opponent strength remains a limitation in the historical rankings. Canada performed well in the 2026 World Cup but did not compete against particularly powerful teams, allowing its score to be slightly inflated.
Retrospective Backtest
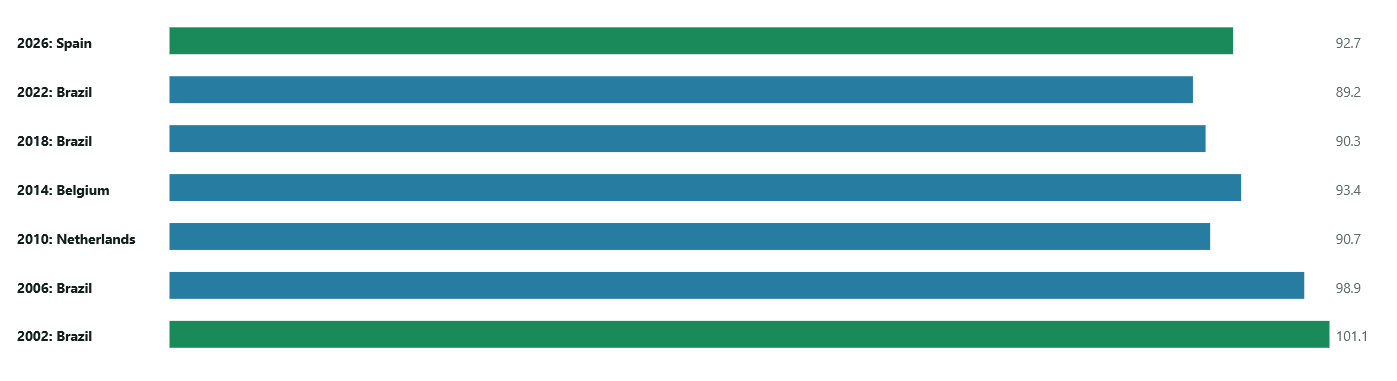
Figure 10. Retrospective champion screen.
I used the available statistics to screen for the likely champion. This is a retrospective test, not a pre-tournament forecast, and older tournaments have less data.
Only two of the seven retrospective champion screens matched the actual winner: 2002 Brazil and 2026 Spain. Brazil was the model winner in several other years, but the model missed Argentina in 2022, France in 2018, Germany in 2014, Spain in 2010, and Italy in 2006. This is not a true pre-tournament forecast because some inputs, such as points per match and win rate, already contain tournament results.
Group Stage and Knockout Stage
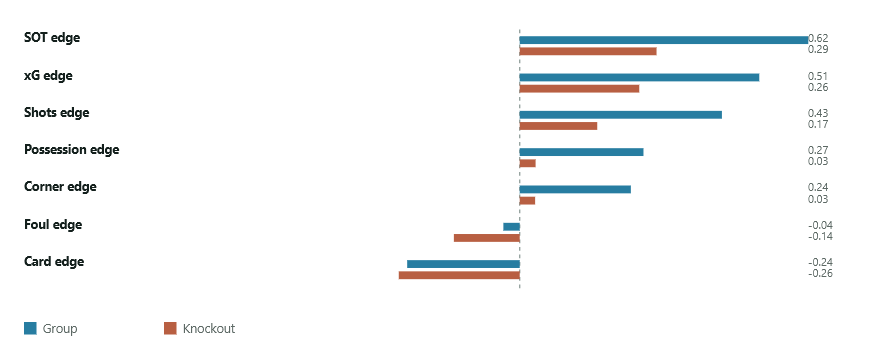
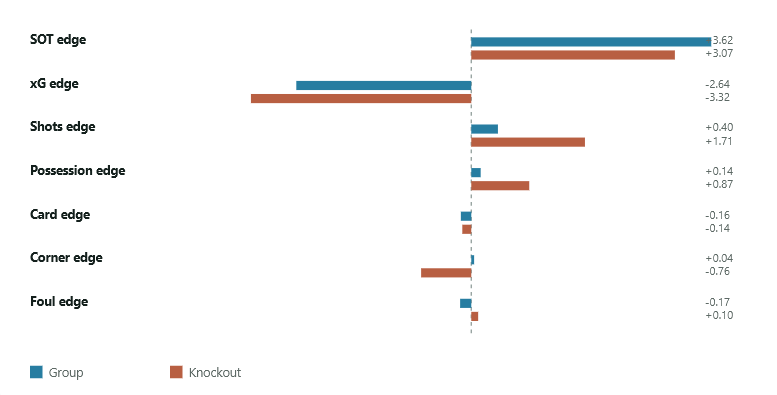
Figure 11. Group-stage and knockout-stage results.
The group-stage logistic model uses 129 complete non-drawn matches, while the knockout model uses only 51. Shots on target remain a positive signal in both stages. Discrepancies most likely come from the smaller sample size of knockout-stage data.
Change Over Time
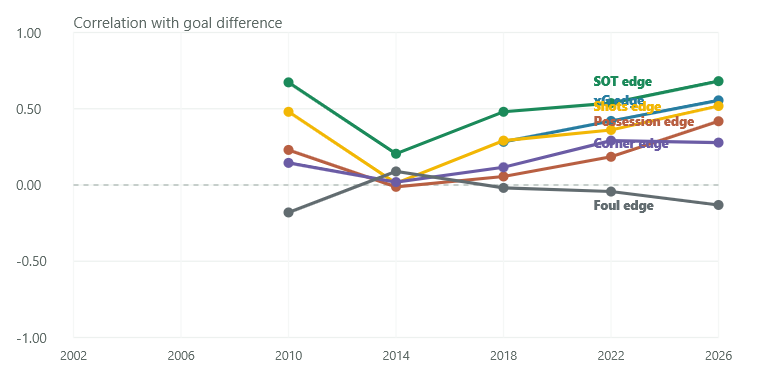
Figure 12. Correlations by tournament year.
The correlations appear to increase over time. Some are stronger in later tournaments, but this may reflect better data coverage, changing definitions, the 2026 48-team format, or real changes in play.
Limitations and Next Steps
The strongest result in this analysis is that shots-on-target edge is consistently related to winning. That does not mean it will identify every winner. The analysis uses only seven tournaments, several fields are missing in older files, and matches within a tournament are not fully independent.
Future versions should include expanded tournaments, such as World Cup qualifiers, and player information. An Elo-style method for ranking opponents would also provide a stronger way to balance the scores.
Using these estimates to predict new matches and tournaments is a key area of future work. Comparing and improving the estimates against other predictors, such as prediction markets, would provide a way to judge efficacy and improvement over time.
Conclusion
The main conclusion is simple: teams that create more shots on target than their opponents usually win and have a better score. xG, total shots, possession, cards, and defensive measures add useful context, but they overlap and should not be treated as proof. Spain combined strong results with a strong overall profile in 2026, and the raw goalkeeper proxy also matched Unai Simon's Golden Glove. The historical data supports the broad attacking-pressure result, while the smaller metrics show why careful definitions, uncertainty, and better validation matter.
— Nikhil